7d, 30d, or weekly as the range parameter and returns the same data the dashboard chart displays, including credits, requests, crawls, tokens, CAPTCHAs, and latency.
See the Usage Stats API reference for the full response schema and authentication details.
This helps you stay on top of your spending, catch unexpected spikes, and decide when you need more credits or a higher plan.
Time Ranges
You can filter the chart by three time ranges:| Range | What it shows |
|---|---|
| 7 days | Daily usage for the past 7 days |
| 30 days | Daily usage for the past 30 days |
| Weekly | Week-by-week totals for the past 7 weeks |
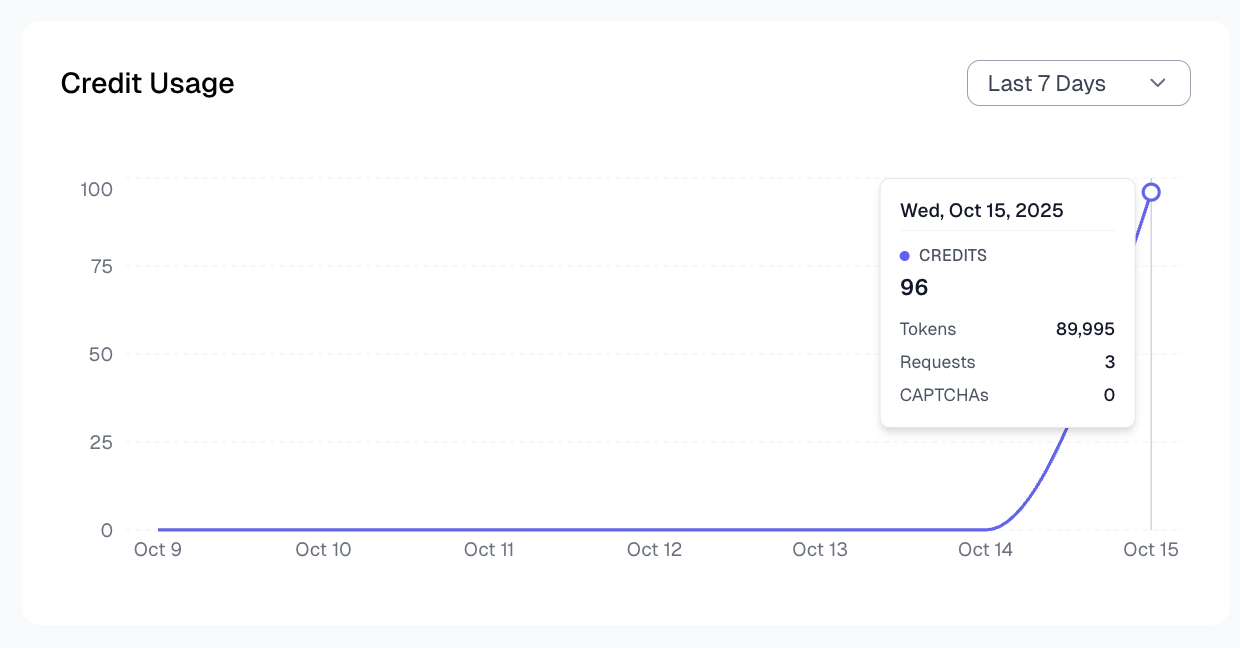
What the Chart Tracks
The usage chart covers six metrics. You can toggle each one on or off depending on what you want to focus on.| Metric | What it means |
|---|---|
| Credits consumed | Total credits spent in the selected period |
| Requests | Number of scrape jobs submitted |
| Crawls | Number of crawl jobs submitted |
| Tokens used | Raw token count from AI extraction (input + output) |
| CAPTCHAs solved | Number of CAPTCHAs Spidra bypassed on your behalf |
| Avg latency | Average response time in milliseconds across your requests |
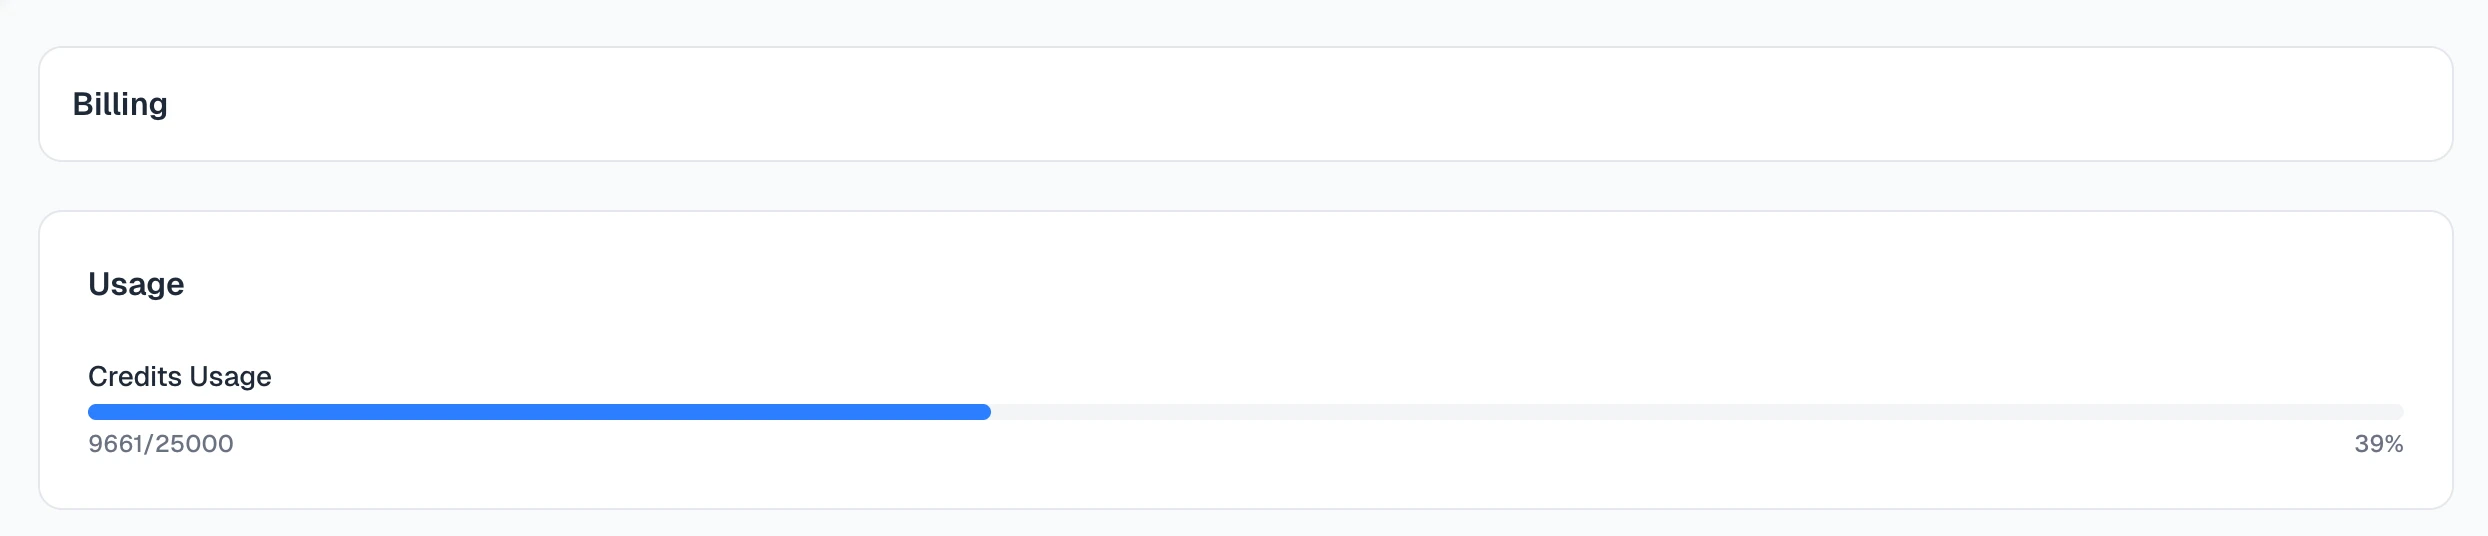
Your Credit Balance
At the top of the Billing page you will see your current credit balance as a progress bar. It shows:- How many credits you have used this billing cycle.
- How many you have remaining.
- Your total monthly allowance from your plan.
- Any top-up credits you have available.