Quick Access and Summary
At the top of the dashboard, you’ll find quick stats including:- Total Scrapes – Number of successful scraping jobs you’ve run.
- Total Presets – Count of saved configurations from the Playground.
- Total Integrations – Number of currently active integrations with third-party platforms.

These stats give you a quick pulse on your account activity
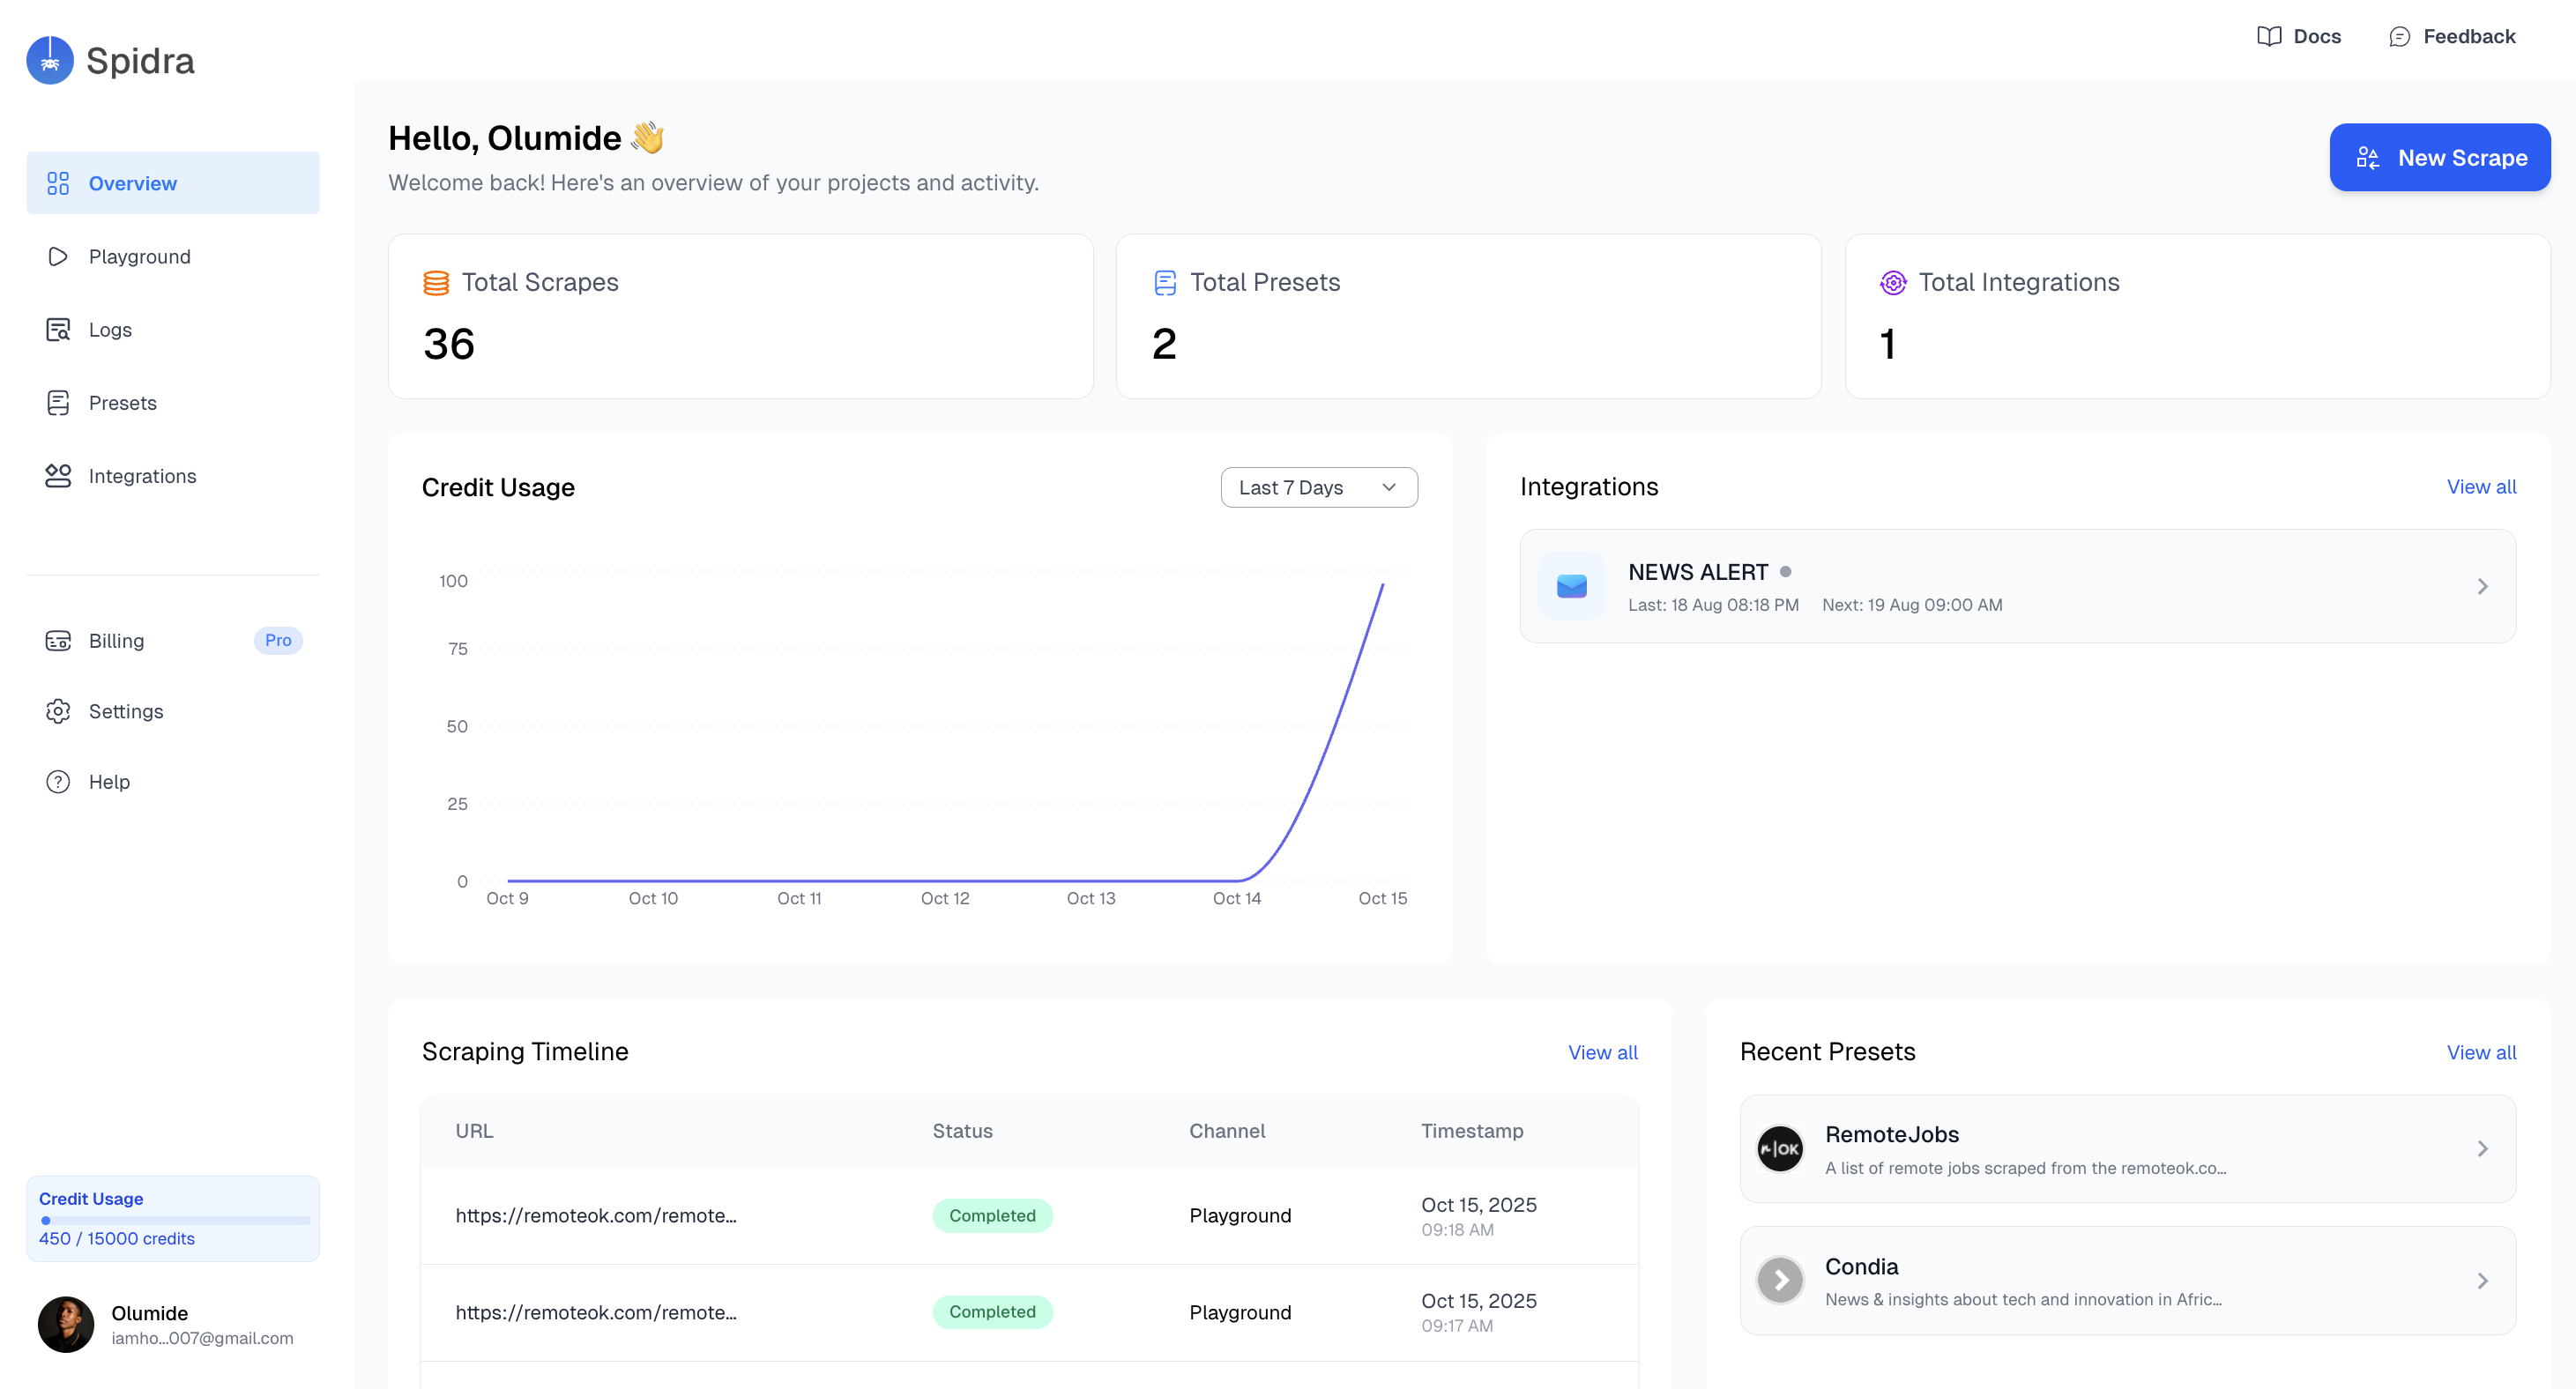
Usage Analytics
Spidra includes a built-in credit usage chart so you can monitor your consumption over time. This chart breaks down:- Credit Used
- Total Requests
- Tokens Used (powered by LLM interactions)
- CAPTCHAs Solved (if bypass mechanisms were triggered)
On the dashboard you also find the following:
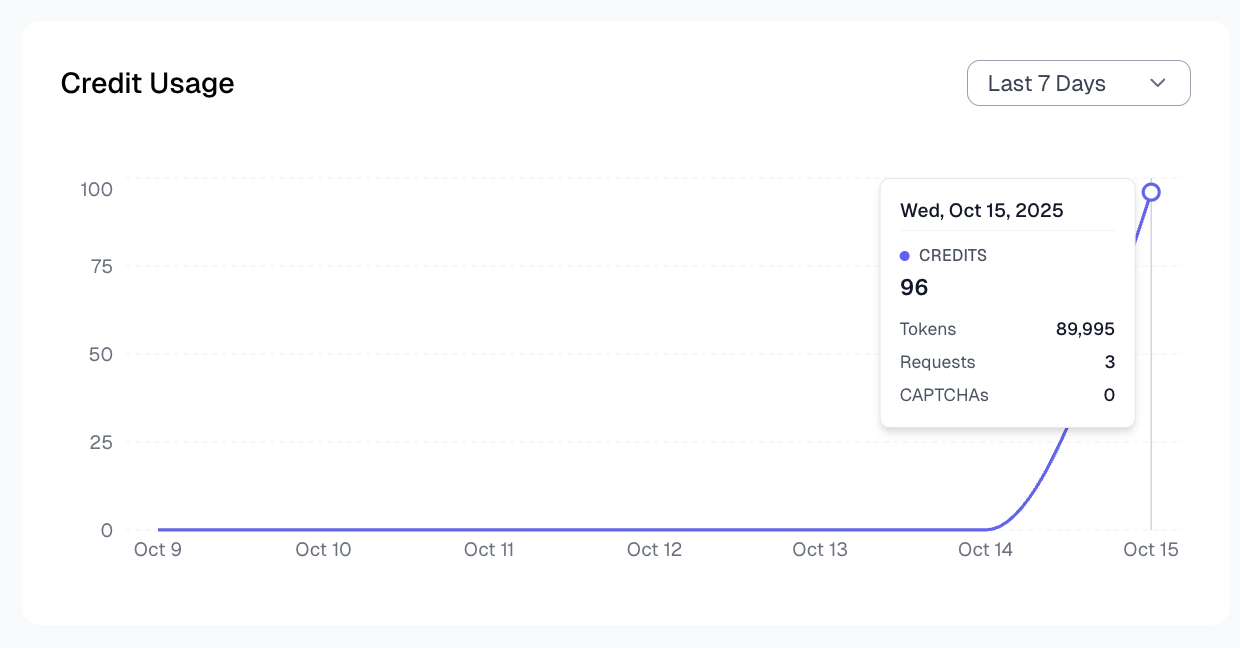
- Recent Integrations: You’ll see a card showcasing your 2 most recent integrations, including their:
- Integration type (e.g. Slack, Discord, Email)
- Status (active/inactive)
- Last run & Next run
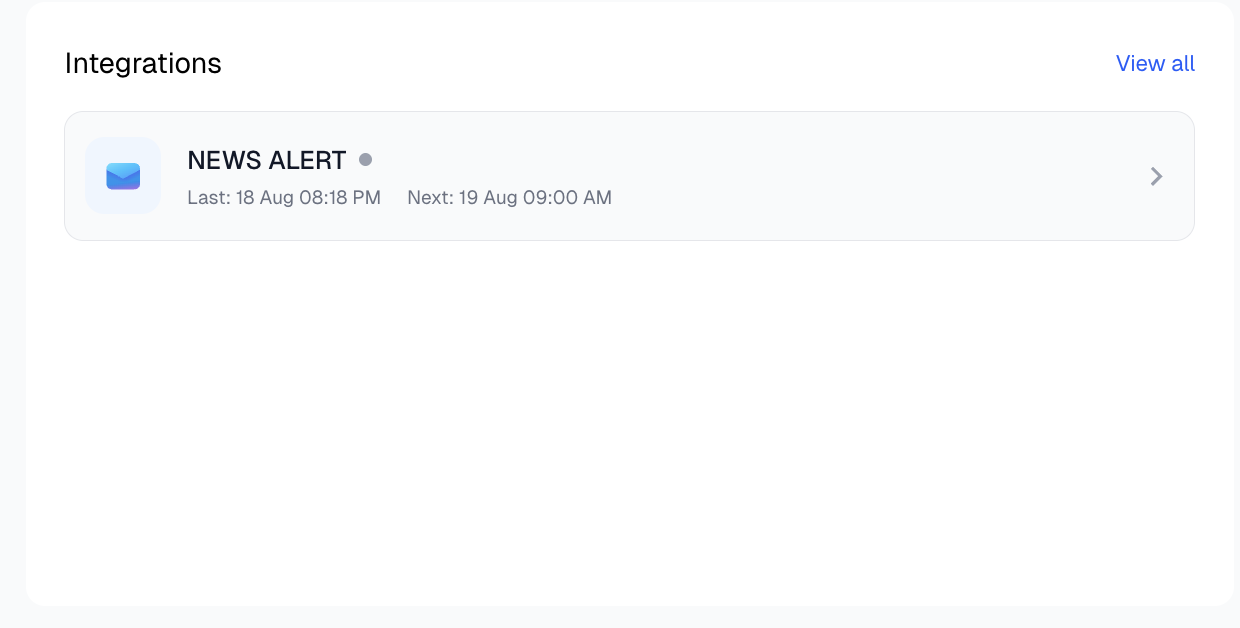
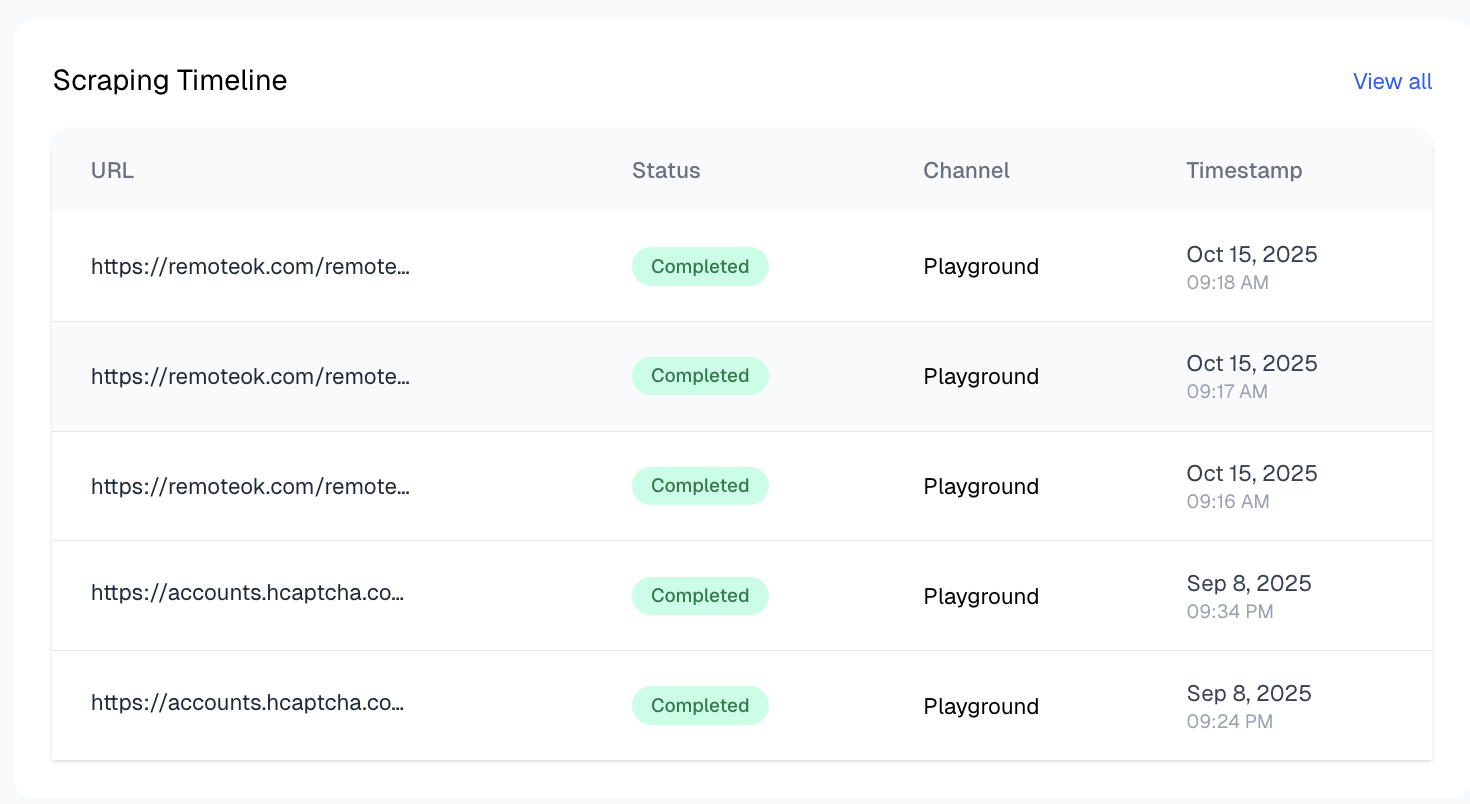
- Scraping Timeline: Another card presents your Scraping Timeline, giving a high-level chronological view of recent scraping jobs.
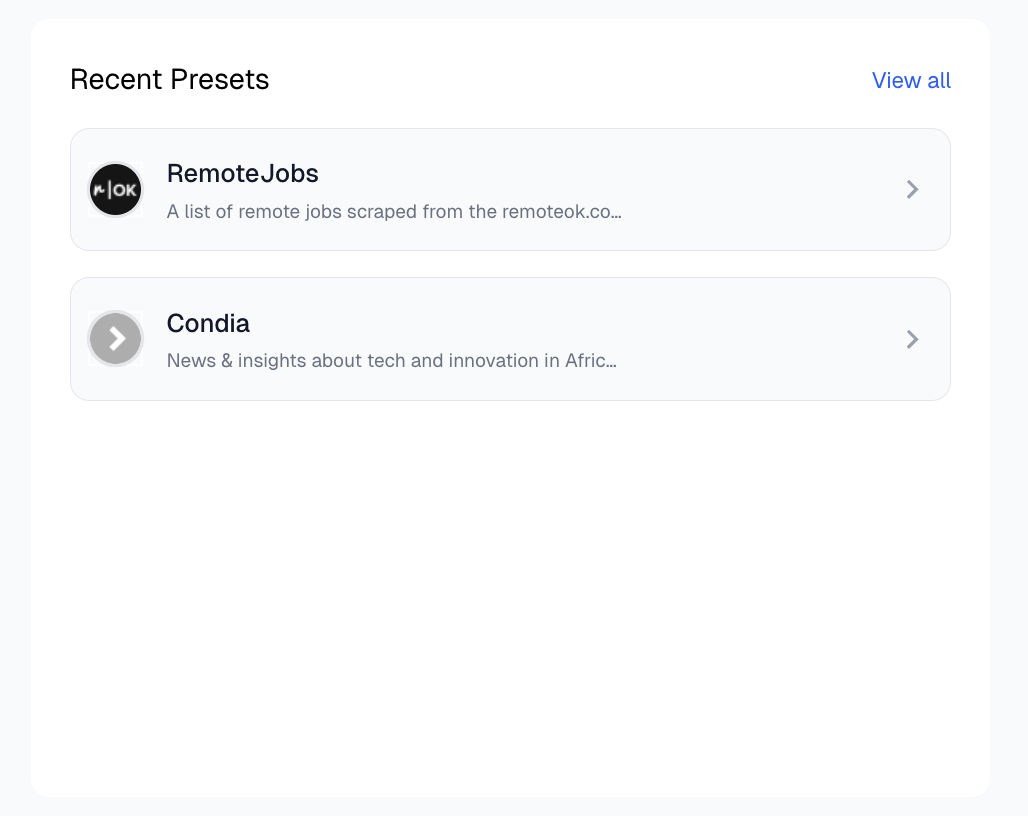
- Recent Presets: The final card on the dashboard summarizes your most recently saved presets. Each card includes: preset Name & description